 HuntGrid
Offshore
Sea surface temperature and temperature breaks
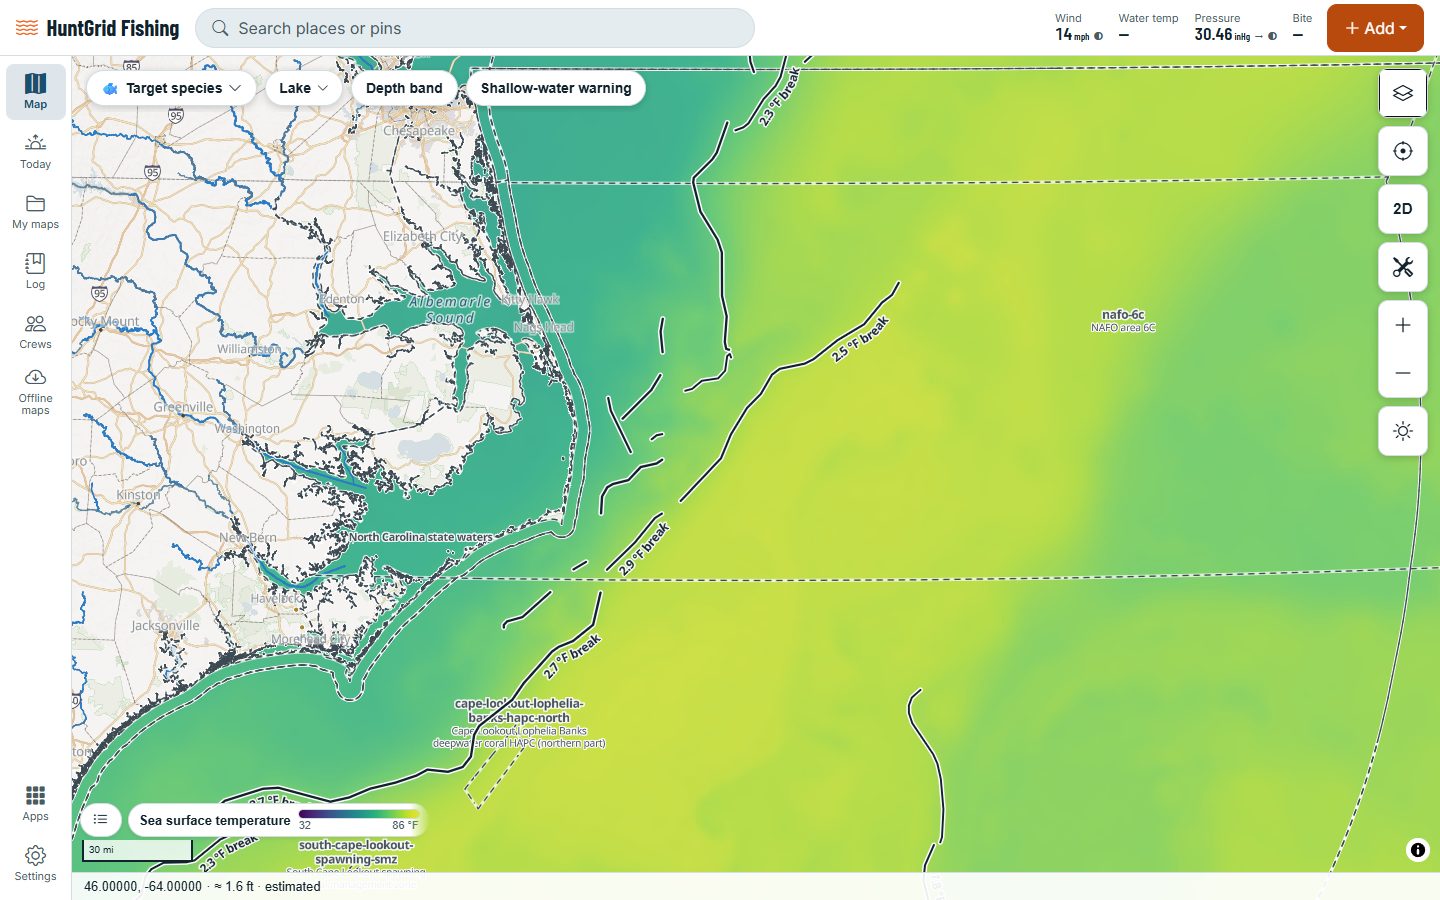
See the water’s surface temperature from a daily satellite analysis, for the coasts of the US and Canada and the Great Lakes. Break lines mark where the temperature changes fast, and a highlight shows only the band your fish like.
Map data © OpenStreetMap contributors, © OpenMapTiles; terrain: Copernicus WorldDEM-30 (credits)
Find the edge
Anglers look for temperature breaks because bait and fish often gather along them.
Daily sea temperature
NASA’s MUR analysis, about 1 km across, for US and Canadian waters, and NOAA’s GLSEA for the Great Lakes.
Break lines
Lines where the temperature changes sharply over a short distance. Lines shorter than 5 km are left out.
Your temperature band
Colour only the water inside a band you pick, say 72 to 76 °F. One-tap bands exist only for fish whose range is published, with the source shown.
Water colour
Chlorophyll from the VIIRS satellite, with colour-break lines between clear blue and green water, dated by image.
Surface currents
Ocean current arrows with a time slider, labelled as model guidance.
Buoys
Water temperature measured at buoys, with the age of each reading.
Map data © OpenStreetMap contributors, © OpenMapTiles; terrain: Copernicus WorldDEM-30 (credits)
Honest maps
No false fronts at cloud edges
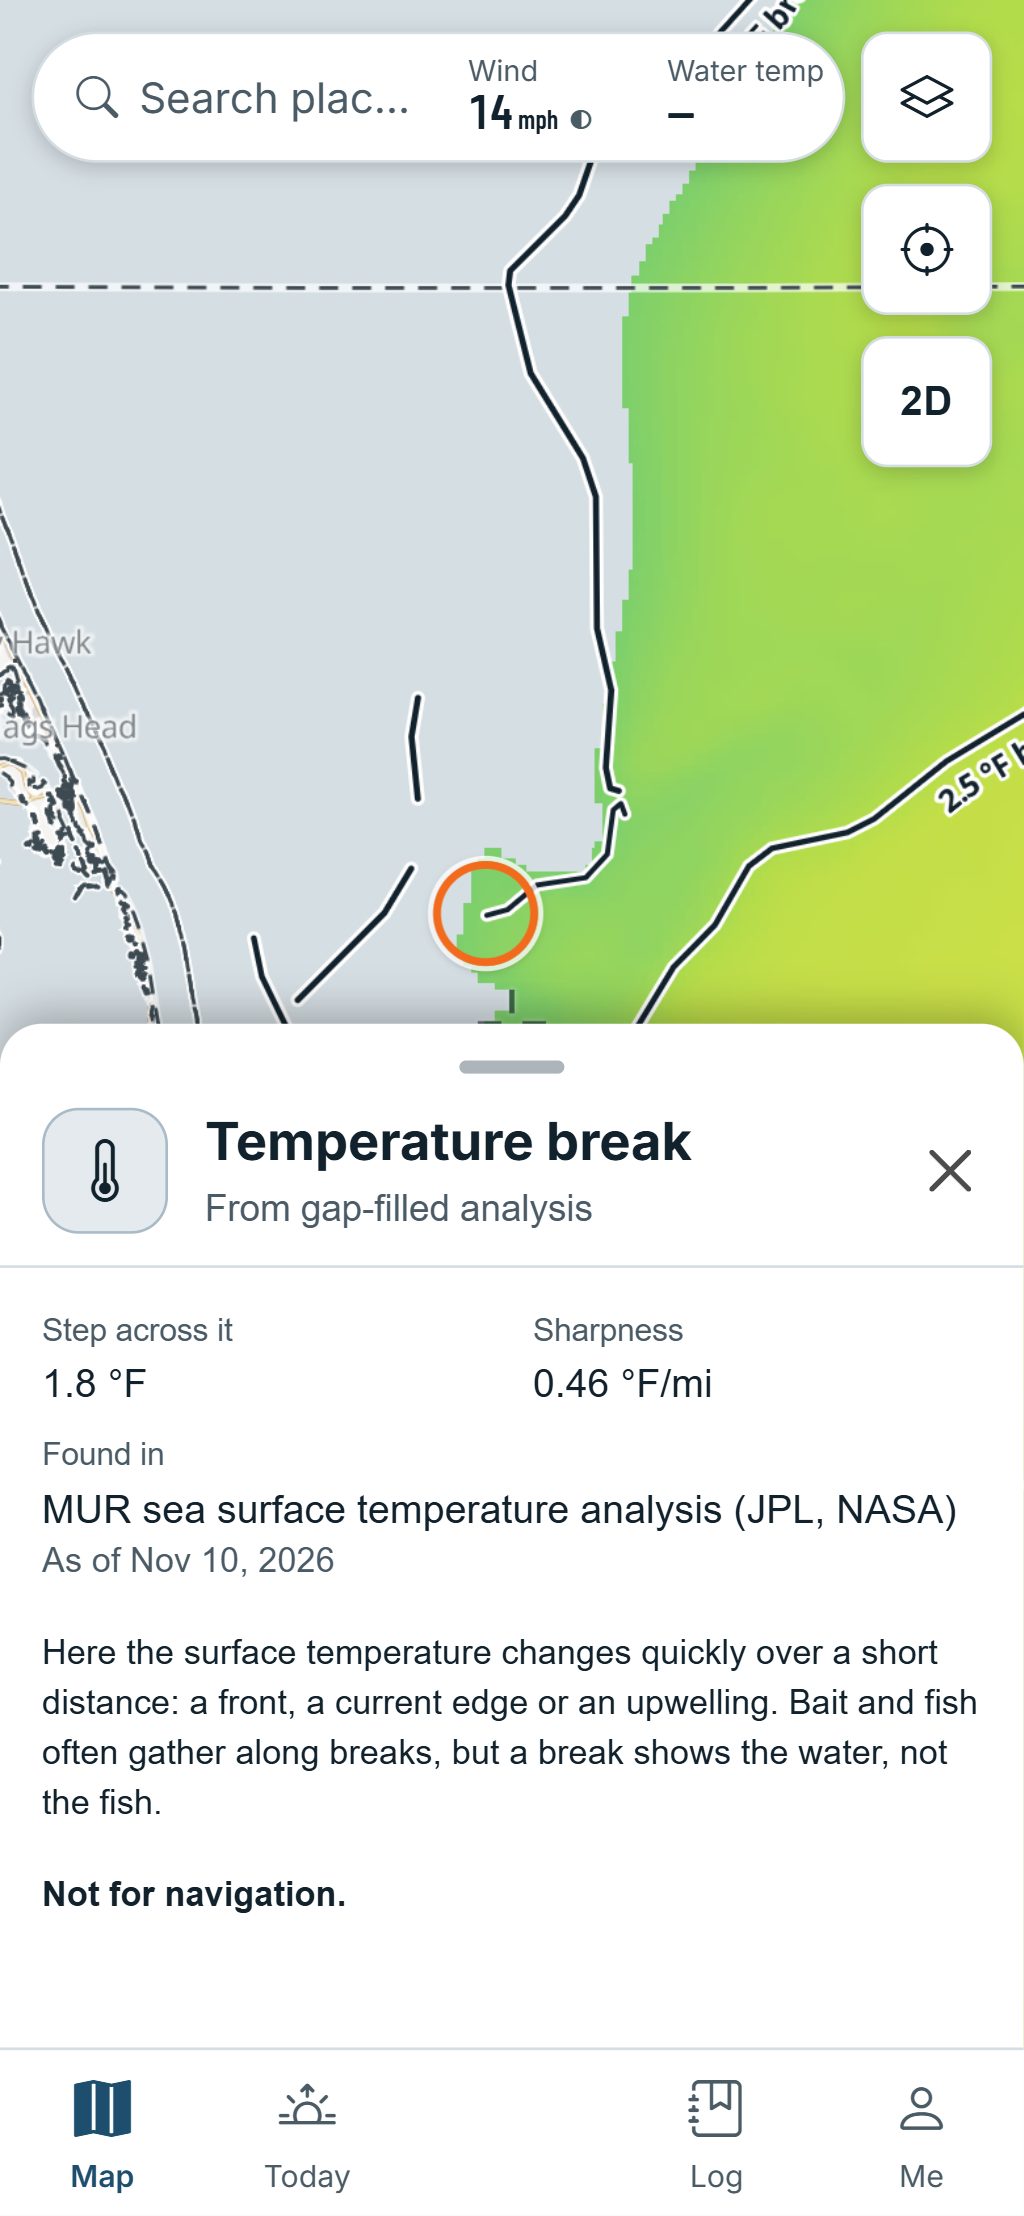
Clouds hide the sea from satellites. The daily analysis fills those gaps, so HuntGrid is careful where it draws breaks.
- No break is drawn where the analysis is unsure of the temperature, or next to a gap.
- Breaks from the filled-in analysis are labelled “from gap-filled analysis”.
- Every map shows its date.
- An offshore download carries the latest sea temperature, at low zoom and labelled with its date.
Sea temperature maps help you choose where to look; they aren’t for navigation. Check the marine forecast before heading offshore.
Questions
Still have a question? Read the HuntGrid Fishing help pages or email support@huntgrid.net.
Where does the sea temperature come from?
From MUR, a daily sea surface temperature analysis from NASA’s Jet Propulsion Laboratory, for US and Canadian waters, and from NOAA’s GLSEA for the Great Lakes. Both are open data.
What is a temperature break?
A line where the surface temperature changes quickly over a short distance, like the edge of a warm current. HuntGrid finds them from the daily map and draws the strongest ones.
Why do some breaks say “from gap-filled analysis”?
Satellites can’t see through clouds, so the daily analysis fills those areas in. Breaks drawn from it say so, and none is drawn where the analysis is unsure or next to a gap.
Your next fishing trip starts on the map
Create a free account and open HuntGrid Fishing in your browser. The same account works for HuntGrid Hunt.
Already have an account? Sign in