 HuntGrid
Hunting weather
Hunting weather for the exact spot you hunt
The wind real weather stations are reading right now, official forecasts from the National Weather Service and Environment and Climate Change Canada, radar, animated wind flow and weather alerts, on the same map as your stands. Imperial or metric, your choice.
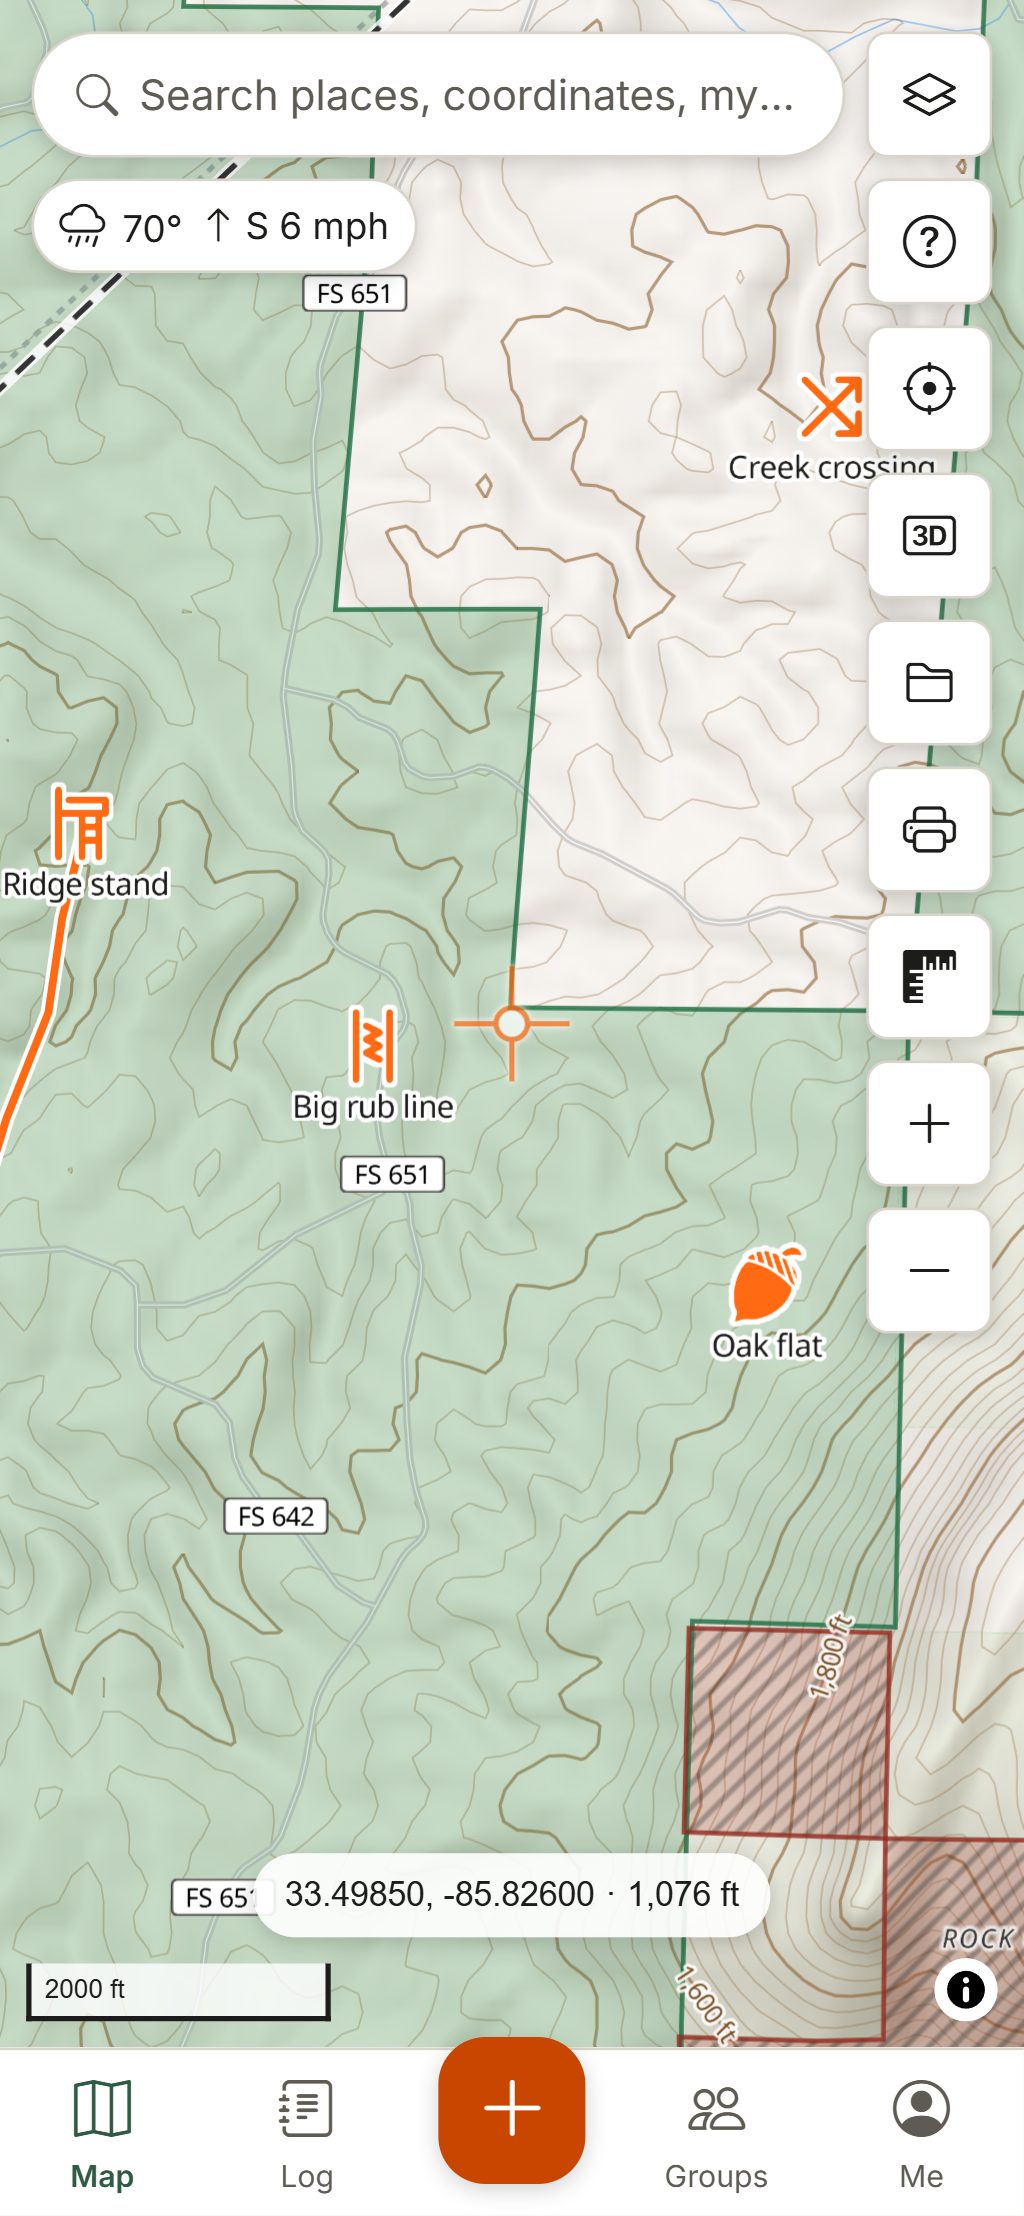
Map data © OpenStreetMap contributors, © OpenMapTiles; terrain: Copernicus WorldDEM-30 (credits)
Weather that matters on a hunt
The forecast covers the whole world. Observations, official forecasts, alerts and radar come from national weather services and public networks, credited on every screen.
Live weather stations
Thousands of stations across the US and Canada (airports, Environment Canada and provincial networks, highway weather stations and SNOTEL mountain sites) each draw an arrow for the wind they measured, with the reading beside it.
Official 7-day forecasts
The City forecasts layer puts each town’s official forecast on the map with the high and the night’s low: Environment and Climate Change Canada’s city forecasts and the National Weather Service’s for US towns. Tap one for every period, in the agency’s own words.
Weather nearby, anywhere
Right-click or long-press any spot and choose Weather nearby: the stations observed around it, then the closest official forecast, with its place, distance and direction from your spot.
Wind flow and wind maps
Wind flow draws streaks drifting with the forecast wind, faster where it’s stronger. Add forecast wind arrows, and wind speed, gust, temperature and cloud maps for the hours ahead.
One time bar
Radar, the forecast maps and the forecast wind share one time bar: scrub or play from the last hour of radar into the forecast hours, and every timed layer shows the same moment.
Radar, lightning and alerts
Animated radar across Canada and the US (and much of Europe), lightning density, and official warnings from Environment and Climate Change Canada and the US National Weather Service, shown unaltered with the issuing office and their outlines on the map.
Hourly forecast for your spot
Tap the conditions chip for hourly cards (wind, gusts, pressure, humidity), daily highs and lows, the nearest station’s 3-hour pressure trend and the official forecast in the US and Canada.
Smoke, fire, snow and water
Wildfire smoke forecasts, fire perimeters and hotspots, fire danger in Canada, snow depth for tracking days, and river and lake gauges with a 7-day chart.
How to use it
Plan a hunt around the weather
Check the days ahead
Open the forecast for your area and look for fronts: a change in wind direction, falling pressure or a temperature drop.
Pick the stand
Each stand’s hunt score weighs the wind, pressure trend and temperature change for you, and Today ranks your stands for the next sit.
Save it for offline
An offline area saves the forecast across it and refreshes it whenever you’re online, so the hourly cards still open in the bush.
Let the log remember
Every sighting, harvest and hunt records the weather at that moment, later refined with observed weather. Hunt log.
What to watch, by the way you hunt
Stand hunters
Hourly wind direction for each stand, the pressure trend and the temperature swing behind a cold front. Deer hunting.
Waterfowlers
Wind speed and gusts for setting decoys and running a boat, radar for incoming fronts, and river and lake levels at nearby gauges. Waterfowl hunting.
Backcountry hunters
Lightning on exposed ridges, snow depth, wildfire smoke and fire perimeters before a long drive, and the forecast saved for days without signal.
Safety first in bad weather
Lightning, high wind and ice make tree stands and open water dangerous. Watch the alerts and radar before you go, and come down early when a storm builds. HuntGrid isn’t an emergency service: for an emergency, call your local emergency number.
Questions
Still have a question? Read the help pages or email support@huntgrid.net.
Where does HuntGrid’s weather come from?
Forecasts come from weather models we run on our own servers, with MET Norway, the US National Weather Service and Environment and Climate Change Canada as sources and fallbacks. Radar, alerts and official forecasts come from national weather services. Every screen credits its source.
Does barometric pressure affect deer movement?
Many hunters watch for pressure changes around fronts. HuntGrid shows the forecast pressure trend and the nearest station’s 3-hour trend, and the hunt score counts a falling or rising pressure among its reasons, so you can compare it with your own sightings.
Does HuntGrid show severe weather warnings?
Yes. Official warnings from the National Weather Service in the US and Environment and Climate Change Canada appear unaltered, with the issuing office, on the map and on the What’s here card. Some European countries’ warnings are included too.
Can I see the weather offline?
Yes, the last saved forecast. Each offline area saves the forecast across it, refreshed whenever you’re online, and the app keeps the last forecast you opened. Radar, alerts and station readings need a connection.
Can I use Fahrenheit and mph?
Yes. Choose °F, mph and inches or °C, km/h and millimetres in settings; the whole app follows.
Can I see the live wind on a map?
Yes. The Weather stations layer shows the wind measured at thousands of stations across the US and Canada as arrows with the reading, and Wind flow animates the forecast wind across the map. Both need a connection.
Where do I find the official forecast for a town?
Turn on City forecasts to see each town’s official 7-day forecast from the National Weather Service or Environment and Climate Change Canada, or right-click (long-press on a phone) any spot and choose Weather nearby for the closest one.
Your next hunt starts on the map
Create a free account, download your area and head out. No credit card, no per-state fees.
Already have an account? Sign in